AI Reporting & Analytics
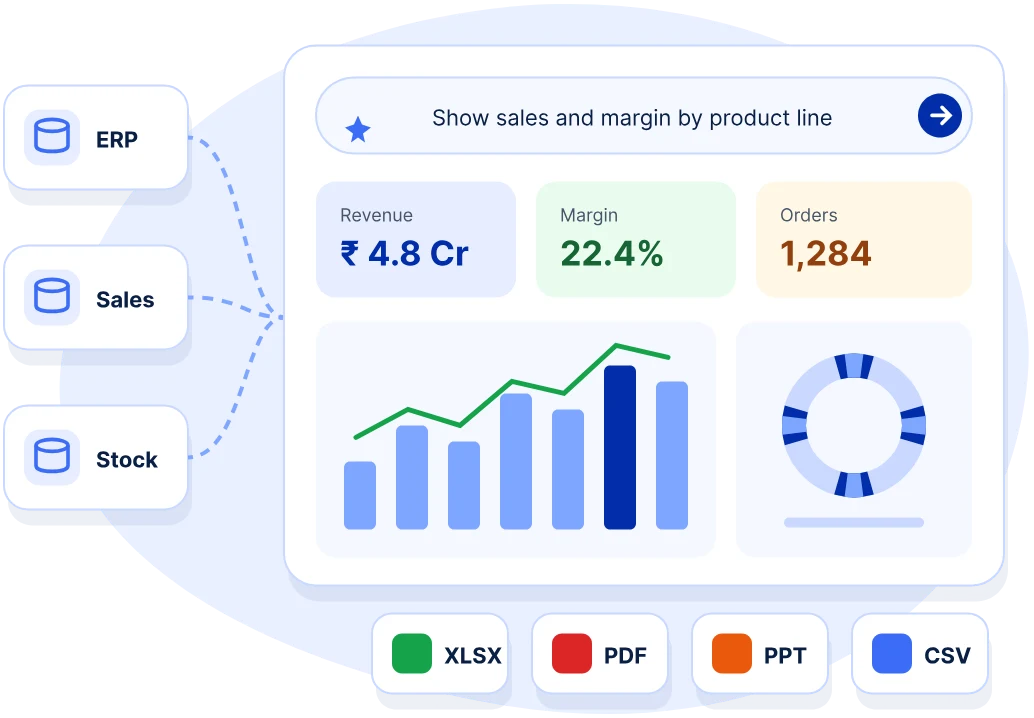
We connect operational data across your business and transform it into meaningful reports, interactive dashboards and intelligent insights.
With ASTR AI, ask questions in natural language, analyse information across connected applications and get the answers you need without manually searching through multiple systems.
“Our business generates data everywhere, but getting one clear answer takes too much time.”
Does your business work this way?
Getting reports from different departments takes days.
Sales, inventory and financial numbers don't always match.
Teams spend more time preparing reports than analysing them.
Business performance is difficult to understand in real time.
Finding specific information requires opening multiple applications.
Management decisions depend on outdated reports and manual calculations.
We have data, but cannot easily understand what is causing changes in performance.
Every new business question requires someone to prepare another report.
Answers in Seconds, Not Reports in Days.
01
Unified Data Model
Bring information from sales, purchases, inventory, finance, production, logistics and connected systems into a structured reporting environment.
02
AI-Powered Reporting
Ask business questions in natural language and retrieve relevant information from connected data sources.
03
Interactive Dashboards
Visualise KPIs, business performance, operational metrics and trends through interactive dashboards.
04
Cross-System Data Analysis
Analyse information across multiple applications to understand how different business activities affect one another.
05
Automated Reports & Alerts
Schedule reports, monitor defined metrics and receive alerts when configured conditions are met.
06
Flexible Report Generation
Generate reports and export information into Excel, PDF and CSV formats.
07
Predictive & Trend Analysis
Analyse historical patterns and use supported forecasting models to estimate potential business trends.
08
Data Governance & Access Control
Configure user permissions, data access, reporting rules and audit trails.
How This Engagement Runs
Connect Your Data. Define Your Metrics. Activate Intelligence.
Phase 1
Connect Sources
Integrate Anvaya, Seed Track, ERP systems, databases and other supported applications.
Phase 2
Define Metrics
Establish common definitions for revenue, inventory, production, performance and other business indicators.
Phase 3
Configure ASTR AI
Set up AI-powered data access, reporting workflows and natural-language queries.
Phase 4
Expand Intelligence
Introduce new dashboards, reports, alerts and analytical capabilities as business requirements evolve.
What Changes for Your Team
One Clear View of Your Entire Business.
- One reporting environment across connected applications.
- Less manual report preparation and data collection.
- Ask questions and retrieve information using natural language.
- Compare performance across departments and business locations.
- Identify trends, unusual changes and operational issues.
- Give management access to relevant information without waiting for separate reports.
Ask your business data
These are examples of the questions users could ask when the relevant data sources are connected and configured.
 ASTR AI
- Show me all pending purchase orders and their current delivery status.
- Compare this month's sales with the previous month.
- Which warehouse has the highest stock value?
- Show production output, machine downtime and efficiency by shift.
- What are our outstanding customer payments?
Stop Chasing Reports. Start Asking Better Questions.
Your business already generates valuable information. We connect it, organise it and make it accessible through AI-powered reporting and analytics.
How We Build Your Reporting Intelligence.
We start by understanding your business from the ground up, analysing existing workflows, identifying challenges and uncovering opportunities for improvement. We then design the solution architecture, review it with your team, gather feedback and approvals, and only then move into engineering, implementation and continuous improvement.
- 1
Understand your business
Step 01 · Discover
We start from the ground up, learning how your business really works today.

- 2
Analyse workflows
Step 02 · Analyse
We study existing workflows, identify challenges and uncover opportunities for improvement.
- 3
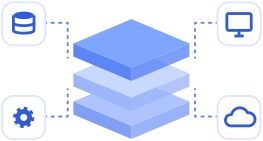
Design the architecture
Step 03 · Design
We design the solution architecture around your requirements and processes.
- 4
Review & approve
Step 04 · Align
We review the design with your team, gather feedback and get approval before we build.
- 5
Engineer & implement
Step 05 · Build
Development, integration, testing, deployment and onboarding.
- 6
Improve continuously
Step 06 · Evolve
We keep refining the solution as your operations and requirements evolve.

We don't build first and understand later. We understand first, design together and build what your business actually needs.
Book a DemoLet's talk about your operations.We Love Talking Tech and Business.
Whether you're ready to onboard or just exploring - drop us a message. We respond within one business day.
- info@trikaan.com
- Phone
- +91 90362 22022
- Office
- 657/23, 13 Cross, Asha Township, Doddagubbi, Hennur Road
Bengaluru, Karnataka 560077, India - Follow us