Trikaan
  • Anvaya

    AnvayaConnected business operations - supply chain, sales, finance, HR and more on one platform.

    Anvaya apps

    Overview →

    Supply Chain & Operations

    Procure MarketplaceProcureInventoryWarehouseProductionQualityLogistics

    Commercial Operations

    Sales E-comSalesTicketing

    Financial Management

    LedgerGSTDocuments

    Workforce Management

    HRContractorsAudit LogsEmployee Portal

    Customer Engagement

    Customer SupportConnectAnnouncements

    Business Administration

    Users & RolesWeighbridgeManage VisitorQR Scan

    Intelligence & Platform

    DashboardAstra AI

    ASTR AI Suite

    ASTR ProductionProduction intelligence - recipes, smart BOM, costing, planning and quality.Astr AIThe AI layer across every Trikaan product - ask, analyse and automate in plain language.ASTR Drawing & Plan GeneratorTurn customer drawings into BOM, BOQ, cutting lists and production plans.ASTR Reporting AssistantAsk in plain language - get reports in Excel, PDF, CSV or PPT.Machine Digital TwinLive machine models connected to PLC & SCADA data for OEE and maintenance.

    Agriculture

    Seed TrackField intelligence for seed production - growers, fields, visits, QA and yield.
    Not sure which product fits your business?Book a Demo →
  • Industries

    FurnitureFrom concept to engineering, powered by AI.FMCGFrom product planning to market execution.PharmaceuticalFrom formulation to compliance.AutomotiveFrom component design to vehicle manufacturing.Food & BeverageFrom ingredients to finished products.ConstructionFrom project planning to execution.ChemicalFrom chemical formulation to process optimisation.Agri & SeedFrom grower’s field to sealed seed bag.
    Industry-specific solutions. Powered by ASTR.All industries →
  • Build & Integrate

    Software built around your process

    Workflow Digitisation & OptimisationCustom Application DevelopmentERP & Systems IntegrationMobile & Field ApplicationsData Migration & Legacy Modernisation

    Engineering & Automation

    From drawings to the shop floor

    Drawing-to-Production EngineeringPLC, SCADA & Hardware IntegrationDigital Twin & 3D Plant ModellingPredictive Maintenance & OEEAI Reporting & Analytics

    Operations

    Run the business on connected data

    Procurement & Supply ChainInventory & Warehouse SolutionsProduction Planning & SchedulingQuality & Compliance SystemsCosting & Margin Intelligence

    Industry Services

    Industry-focused services

    Manufacturing SolutionsAgri & Seed SolutionsConstruction & Interior SolutionsImplementation, Training & Support
    Beyond software - we engineer around your business.All services →
  • Engineering

    How We WorkEngineeringData SecurityData PrivacyCloud & Hosting

    Your vision. Our engineering.

    Explore our engineering capabilities →
  • Resources

    Blogs

    Field notes from people who spend their days in plants.

    Read the latest insights →
  • Pricing
  • FAQ
Book a Demo
  • Home
Trikaan

Your Business. Connected Through Intelligence.

Products

  • Anvaya
  • ASTR Production
  • Astr AI
  • ASTR Drawing & Plan Generator
  • ASTR Reporting Assistant
  • Machine Digital Twin
  • Seed Track

Industries

  • Furniture
  • FMCG
  • Pharmaceutical
  • Automotive
  • Food & Beverage
  • Construction
  • Chemical
  • Agri & Seed

Services

  • All services
  • Workflow Digitisation & Optimisation
  • Custom Application Development
  • ERP & Systems Integration
  • Mobile & Field Applications
  • Data Migration & Legacy Modernisation
  • Drawing-to-Production Engineering
  • PLC, SCADA & Hardware Integration
  • Digital Twin & 3D Plant Modelling
  • Predictive Maintenance & OEE
  • AI Reporting & Analytics
  • Procurement & Supply Chain
  • Inventory & Warehouse Solutions
  • Production Planning & Scheduling
  • Quality & Compliance Systems
  • Costing & Margin Intelligence
  • Manufacturing Solutions
  • Agri & Seed Solutions
  • Construction & Interior Solutions
  • Implementation, Training & Support

Engineering

  • How We Work
  • Engineering
  • Data Security
  • Data Privacy
  • Cloud & Hosting
  • Network Security & VPN

Company

  • Who we are
  • Pricing
  • FAQ
  • Careers
  • Blog
  • Contact

Apps

  • Procure Marketplace
  • Procure
  • Inventory
  • Warehouse
  • Production
  • Quality
  • Logistics
  • Sales E-com
  • Sales
  • Ticketing
  • Ledger
  • GST
  • Documents
  • HR
  • Contractors
  • Audit Logs
  • Employee Portal
  • Customer Support
  • Connect
  • Announcements
  • Users & Roles
  • Weighbridge
  • Manage Visitor
  • QR Scan
  • Dashboard
  • Astra AI

© 2026 Trikaan Solutions Pvt. Ltd. All rights reserved.

Privacy PolicyTerms of ServiceCookie Policy
Insights › Plant problems

Plant problems

Dead Stock and Stock-Outs at the Same Time: The Inventory Paradox Explained

Warehouses full of the wrong things and short of the right ones. Why it happens and the planning habits that end it.

Trikaan Research & Engineering·10 Nov 2026·4 min read
Dead Stock and Stock-Outs at the Same Time: The Inventory Paradox Explained

KEY TAKEAWAYS

  • Excess and shortage at the same time is a planning problem, not a warehouse problem.
  • Treat items differently: classify by value and demand variability.
  • Reorder levels must include real lead times and their variation.
  • Review slow-moving stock monthly, before it becomes dead stock.

Walk into many factory stores and you will see racks of material nobody has touched in a year, while the purchase team chases an urgent order for something the line needs tomorrow. It feels like bad luck. It is usually the result of treating every item the same way.

This article explains why the paradox happens and the practical planning habits that end it.

How the paradox develops

  • Reorder levels set once and never revisited.
  • Bulk buying for price discounts without a consumption view.
  • Engineering changes leaving old-revision stock behind.
  • Lead times assumed, not measured.
  • Safety stock added after every shortage, never removed.

Classify before you plan

Not every item deserves the same attention. ABC classification ranks items by consumption value; XYZ ranks them by how variable demand is. Together they tell you where to plan tightly and where simple rules are enough.

ClassMeaningPlanning approach
AXHigh value, steady demandTight planning, frequent orders, low safety stock
AZHigh value, erratic demandOrder against firm demand, review weekly
CXLow value, steadySimple reorder level, larger lots
CZLow value, erraticMinimal stock or order on demand

Lead time is a number to measure

Reorder levels depend on how long replenishment takes. Many plants use the lead time a supplier quoted years ago. Measure it from your own purchase orders and goods receipts, and note how much it varies. A supplier who delivers in ten days on average but sometimes takes thirty needs more safety stock than one who always takes fifteen.

Connect inventory to the production plan

For materials driven by production, the plan itself is the best forecast. When BOMs are accurate and the plan is in the system, material requirements can be calculated weeks ahead, and shortages become visible long before the line stops.

In practice: A shortage that is visible three weeks ahead is a purchase task. One that is visible three days ahead is a crisis.

A monthly slow-moving review

  • List items with no movement in 90 and 180 days.
  • Check whether each is tied to an active product or revision.
  • Decide: use, return, sell, rework or write off.
  • Stop reordering anything that is not tied to current demand.

Why ‘just reduce inventory’ backfires

When leadership sets a blanket inventory reduction target, stores cut across the board. High-value, critical items get reduced along with junk, shortages rise, and the target is quietly abandoned a few months later. The classification approach works because it reduces stock where it is safe to do so and protects the items that keep lines running.

Pair the classification with a short weekly meeting between planning, purchase and stores. Fifteen minutes on the top shortages and the top excess items keeps the system honest.

Measuring progress

  • Inventory days by class (A, B, C).
  • Number of stock-outs that stopped production.
  • Value of stock with no movement in 180 days.
  • Urgent purchases as a share of all purchases.

What good looks like

Inventory days fall without more shortages, purchase works from a forward view instead of urgent indents, and stores can explain every item on the shelf. Software makes this sustainable by keeping classification, lead times and requirements current automatically, and by alerting before cover runs out.

Frequently asked questions

What is dead stock?

Inventory with no consumption for a long period, often six to twelve months, and no expected future demand.

How do I set a reorder level?

Reorder level is roughly average daily usage times lead time, plus safety stock that reflects variation in usage and lead time.

What is ABC analysis?

Ranking items by annual consumption value so the few high-value items get the most planning attention.

Can AI predict shortages?

Yes, by combining the production plan, BOMs, stock, open orders and measured lead times to project cover and flag items at risk.

  • #inventory management manufacturing
  • #dead stock
  • #stock out
  • #reorder level
  • #ABC XYZ analysis

Trikaan Research & Engineering

Trikaan

Written by the researchers and engineers who build Anvaya, ASTR and Seed Track, with input from Trikaan's delivery and engineering teams.


ON THIS PAGE

  • How the paradox develops
  • Classify before you plan
  • Lead time is a number to measure
  • Connect inventory to the production plan
  • A monthly slow-moving review
  • Why ‘just reduce inventory’ backfires
  • Measuring progress
  • What good looks like
  • FAQ

Inventory that plans ahead

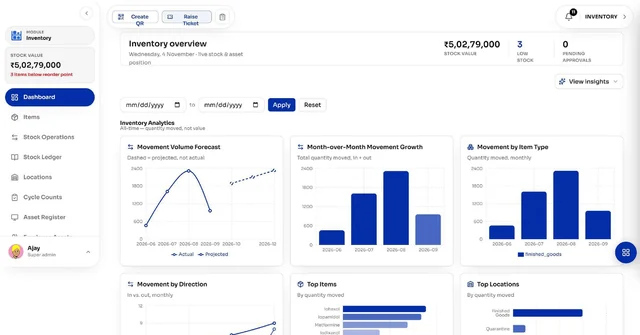
Stock by plant, lot and bin, with shortage forecasts from the production plan in Anvaya.

Explore Anvaya

Keep reading

All insights →

Plant problems · 5 min

Where Yield Goes Missing: A Stage-by-Stage Guide for Process Manufacturers

Plant problems · 5 min

Unplanned Downtime Is a Symptom: How to Find the Causes Your Logbook Hides

Plant problems · 5 min

Why Your Bill of Materials Is Wrong (and What It Is Costing You)

procurement
ASTR AI
quality
engineer
Seed Track
Anvaya
operator
finance
planner

Your Vision. Our Engineering.

Book a Demo

Powered by AI. Engineered by Trikaan.